
DSS-induced gut dysfunction leads to bone and muscle loss in mice
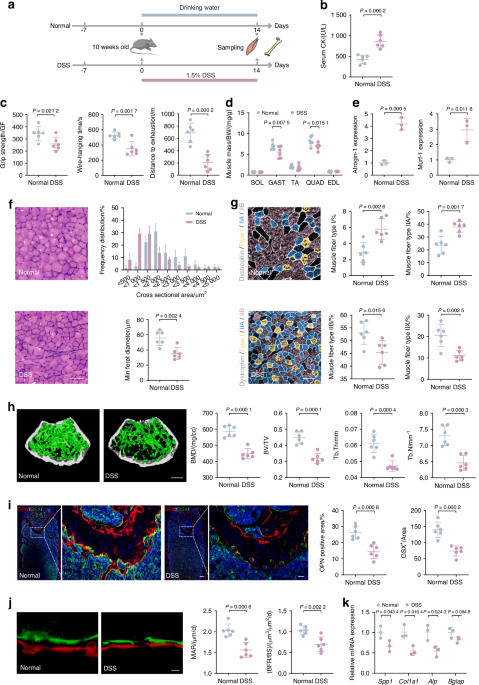
To investigate the connection between gut dysfunction and musculoskeletal deterioration, we induced colitis in mice with DSS exposure (Fig. 1a). The phenotypes of the gut were assessed, revealing disrupted intestinal function (Fig. S1). Serum creatine kinase (CK) concentrations have historically been used as muscle damage indicator,22 and our finding that DSS-exposed mice had increased serum CK levels indicated apparent muscle damage (Fig. 1b). Subsequent behavioral analyses revealed that DSS-exposed mice displayed significant reductions in limb grip strength, wire-hanging time, and exercise capacity (Fig. 1c). Thus, gut dysfunction does deleteriously affect muscle function in mice. Through dissecting the posterior limbs of mice, gastrocnemius (Gast) and quadriceps (Quad) weights were found significantly reduced (Fig. 1d); these altered muscle profiles were consistent with the changes we observed in behavior analysis. Moreover, qPCR analysis showed increased expression of muscle atrophy markers Atrogin-1 and Murf-1, both of which encode E3 ubiquitin ligases,23 in Gast after DSS exposure (Fig. 1e).

DSS-induced gut dysfunction leads to bone and muscle loss in mice. a Schematic representation illustrating the experimental design. Mice were exposed to dextran sodium sulfate (DSS) in DSS group and PBS in normal group for 2 weeks. b Measurement of CK activity of the serum (n = 6). c Assessment of physical performance using all-limb force, longest suspension time, and distance to exhaustion evaluated by handgrip, hanging wire tests, and treadmill, respectively (n = 6). d Muscle mass analysis from each group (n = 6). e mRNA expressions of Atrogin-1 and Murf-1 in gastrocnemius, tested by qPCR (n = 3). f Representative images of H&E staining in gastrocnemius cross-sections, with the frequency distribution of CSA and quantification of average minimal Feret’s diameter of myofibers (n = 6). Scale bar, 100 μm. g Representative immunofluorescence images to visualize specific types of muscle fibers and quantification. Type I (purple), type IIA (green), type IIX (not shown), and type IIB (red) (n = 6). Scale bar, 100 μm. h Representative micro-CT images of distal femoral metaphyseal trabecular bone. Quantitative analysis of bone mass, including BMD, BV/TV, Tb. Th, and Tb. N (n = 6). Scale bar, 500 μm. i Representative images of OSX (green) and OPN (red) immunostainings and quantification of OPN+ and OSX+ area on distal femurs (n = 6). Scale bar, 200 and 50 μm, respectively. j Representative images and quantification of new bone formation assessed by dynamic histomorphometric analyses (n = 6). Scale bar, 25 μm. k mRNA Expressions of osteogenesis gene (Spp1, Col1a1, Alp, and Bglap) expression in tibia, tested by qPCR (n = 3). Values are represented as the average ± standard deviation. The significance level (P value) was determined through a two-sided Welch’s t-test
To investigate the effects of DSS exposure on muscle structure, we performed H&E staining in Gast, which is widely recognized as a representative skeletal muscle due to its size, accessibility, and its ability to reflect the systemic skeletal muscle response.24 Muscle fibers of the DSS-exposed group displayed irregular shapes and sarcolemma membrane disruption. Besides, there was a leftward shift in the curve that represents the cross-sectional area (CSA), resulting in a marked decrease in Feret’s diameter (Fig. 1f). Different fiber types have unique physiological and metabolic properties, and the fiber type compositions can change under conditions like aging, injury, and physical training, which potentially affects muscle functions.25,26 Immunofluorescence staining for fiber types revealed that in typical mice, type IIB fibers predominated, succeeded by types IIA, IIX, and I (Fig. S2a). However, DSS exposure led to noticeable reductions in the proportion of type IIB and IIX fibers and increases in type I and IIA fibers, suggesting a transition from the glycolytic nature toward the oxidative characteristics (Fig. 1g and Fig. S2a). These findings suggest a shift in muscle metabolism after DSS exposure, which may have contributed to the observed muscle function declines.
Additionally, microcomputed tomography (micro-CT) scans showed decreased trabecular bone in the femur of DSS-exposed mice, reflected by reduced bone mineral density (BMD), bone volume/total volume (BV/TV), trabecular thickness (Tb. Th) and number of trabeculae (Tb. N) (Fig. 1h). These findings confirmed that the DSS exposure resulted in reduced bone mass and compromised bone microarchitecture. Mechanical stress testing further revealed significant decreases in maximum load, energy to ultimate load, and breaking energy in the DSS-exposed mice (Fig. S2b), indicating mechanical defects and bone fragility. Osteoblasts are essential for bone formation.27 To study osteogenic protein expression within the bone tissue, we performed immunofluorescence staining of femur samples target for bone osterix (OSX), osteopontin (OPN), osteocalcin (OCN), and tartrate-resistant acid phosphatase staining (TRAP).28 We found that DSS exposure decreased the numbers of OSX, OPN, and OCN (Fig. 1i and Fig. S2c), suggesting reduced bone-creating processes and mineral integration. We also found that TRAP staining enhanced in DSS-induced group (Fig. S2d), suggesting increased bone absorption. Moreover, we quantify bone metabolism markers in serum, which show the same result as immunofluorescence staining. The result showed that type I N-terminal propeptide (P1NP) as an indicator of bone formation decreased and C-terminal telopeptide of type I collagen (CTX-1) as a marker of bone resorption increased in serum (Fig. S2e). Additionally, as indicated by bone histomorphometric analyses, the mineral apposition rate (MAR) and bone formation rate (BFR) of the DSS-exposed group were all significantly reduced, providing further evidence of impaired bone formation (Fig. 1j). qPCR analysis of femur revealed decreased expression of osteogenesis-related genes, including secreted phosphoprotein 1 (Spp1), collagen type I alpha 1 chain (Col1a1), alkaline phosphatase (Alp), and bone gamma-carboxyglutamate protein (Bglap) (Fig. 1k). These findings collectively support that DSS exposure negatively impacts osteoblast physiology and bone formation.
The variance in microbiota composition across pathological conditions like DSS-induced colitis and different ages presents a compelling avenue for investigating its impact on bone and skeletal muscle mass and quality. Thus, we managed to evaluate the influence of microbiota from distinct sources on bone and skeletal muscle mass and quality in DSS-induced colitis mice. Our study employed a fecal microbiota transplantation (FMT) approach, wherein DSS-model mice were assigned into four intervention groups (Fig. S3a). We aim to dissect the differential impacts of microbiota derived from varied host conditions—specifically focusing on age-related and DSS-induced alterations in microbiota composition—on the pathophysiology of bone and skeletal muscle. Interestingly, after administrating FMT to mice, we observed notable reductions in serum CK levels in Normal-FMT and Young-FMT groups than DSS-FMT and Aged-FMT groups (Fig. S3b). In addition, behavioral analyses revealed Normal-FMT and Young-FMT groups have better muscle functions and larger Gast mass (Fig. S3c, d). Besides, H&E staining confirmed augmented muscle integrity and increased muscle fiber size in Normal-FMT and Young-FMT mice (Fig. S3e). For bone, micro-CT data showed enhanced skeletal density and structure with higher BMD in mice with Normal-FMT and Young-FMT (Fig. S3f). Moreover, Normal-FMT and Young-FMT mice showed a significant rise in quantitative enumeration of osteoblasts expressing OCN (Fig. S3g) and a decrease in the number of TRAP-positive osteoclasts compared with DSS-FMT and Aged-FMT group (Fig. S3h). These findings elucidate the differential impacts of microbiota from varied sources on bone and skeletal muscle mass and quality. What’s more, these results underscore the therapeutic potential of FMT, particularly from healthy and young donors, in mitigating the deleterious effects of DSS-induced colitis on bone and skeletal muscle health. These findings pave the way for further exploration of microbiota-based interventions in the management of musculoskeletal disorders associated with inflammatory conditions.
Microbial dysbiosis characterizes gut dysfunction-induced bone and muscle loss in both mice models and human individuals
To explore the gut microbiota’s role in bone and muscle loss, we analyzed microbiomes from control and DSS-treated mice. Through high-throughput Illumina sequencing, open reading frame (ORF) prediction was executed for scaftigs (Fig. S4a). The Venn diagram analysis was also performed (Fig. 2a), while species abundance comparisons were ascertained via Analyses of Similarity (Anosim) (Fig. S4b). Complementing these analyses, α-diversity (Shannon and Simpson indexes) (Fig. 2b) and β-diversity (principal coordinate analysis, PCoA) metrics (Fig. 2c) revealed significant microbial profile differences between these two groups. To further assess the gut microbiota changes, we performed subsequent taxonomic analysis extending from phylum to species level (Fig. 2d). At the phylum level, DSS exposure induced notable decreases in Firmicutes and Actinobacteria, and marked increases in Bacteroidetes (Fig. 2d, left). At the genus level, we observed decreased abundance of Bifidobacterium, Akkermansia, and Clostridium, while genera such as Prevotella, and Lactobacillus were increased (Fig. 2d, middle). At the species level, notable changes included decreased abundance of Bifidobacterium pseudolongum (B. pseudolongum) and Faecalibaculum rodentium (F. rodentium), and increased abundance of Helicobacter magdeburgensis and Bacteroides caecimuris after DSS exposure (Fig. 2d, right).

Metagenomic analysis reveals altered gut microbiota composition following DSS exposure. a Venn diagram analysis of gene numbers detected in two groups. b The box plot illustrates α-diversity using the Shannon and Simpson indices. c Principal coordinate analysis (PCoA) of β-diversity at the phylum tier is conducted via a Bray–Curtis matrix comparison for both groups. d Structure plot of the relative fecal bacterial abundances in phylum and genus-level based on Bray–Curtis distance. Analysis of cladogram generated from LEfSe (e) and the heatmap cluster (f) across different taxa levels. g Analysis of LDA score in the species level. h Quantitative analysis of differential taxa in two groups. Values are represented as the average ± standard deviation. The significance level (P value) was determined through a two-sided Welch’s t-test
These shifts in microbiota composition were confirmed through cluster analysis of relative abundance (Fig. S4c) and LEfSe (Fig. 2e and Fig. S4d). Notably, there was lower abundance of Bifidobacterium, Akkermansia, Eubacterium, and Faecalibaculum, accompanied by higher presence of Lactobacillus and Prevotella in the DSS exposure group (Fig. 2e, f and Fig. S4c, d). Specifically, at the species level, the LDA score demonstrated reduced levels of Firmicutes bacterium M10-2, F. rodentium, B. pseudolongum, and B. animalis, with an increase in Prevotella sp CAG-1031, Lactobacillus johnsonii, Bacteroides sp CAG-927 and Prevotella sp CAG-485 after DSS exposure (Fig. 2g, h). Given Bifidobacterium’s well-documented health-promoting properties, including inflammation modulation, enhanced nutrient absorption, and reinforced gut barrier function,29 we explored how the decline of this probiotic strain might contribute to the pathogenesis of bone and muscle loss.
To further determine whether the changes in gut microbiota in colitis patients share any common characteristics with the changes in gut microbiota in the DSS-induced colitis mice, we collected samples from human IBD patients and healthy individuals, and performed microbiota analysis (Fig. S5). The Venn data analysis was performed to describe the gene numbers detected in IBD patients and health people (Fig. S5a). Augmenting the Venn data, the assessment of α-diversity, as manifested by the Shannon and Simpson indices (Fig. S5b), in conjunction with β-diversity, evaluated via PCoA metrics (Fig. S5c), underscored notable disparities in the microbial compositions between these two groups. To deepen the evaluation of alterations within the gut microbiota, a taxonomic analysis spanning from the phylum to the species level was performed (Fig. S5d). At the phylum level, IBD patients showed notable decreases in Firmicutes and Actinobacteria, and marked increases in Proteobacteria (Fig. S5d, left). At the genus level, there was a noted reduction in the populations of Bifidobacterium, Treponema, and Blautia, whereas an increase was observed in the genera Escherichia–Shigella and Bacteroides (Fig. S5d, middle). At the species level, notable changes included decreased abundance of Blautia_sp_N6H1-15, Bifidobacterium_longum and Bifidobacterium_adolescenties, and increased abundance of Alistipes_puttredinis and Bacteroides_fragilis in IBD patients (Fig. S5d, right). These shifts in microbiota composition were further confirmed through LEfSe and LDA scores (Fig. S5e, f). At the species level, the LDA score demonstrated that IBD patients showed reduced levels of Bifidobacterium_adolescenties, Bifidobacterium_longum, and Actinobacteria, with an increase in bacteria. Notably, there was lower abundance of Bifidobacteriaceae, Oscillospiraceae, and Prevotellaceae in IBD patients (Fig. S5e, f). Same as our result in DSS-induced colitis mice, we find the same decline of Bifidobacterium in colitis patients, thereby strengthening the common microbiota characteristics.
Administration of probiotic B. lactis A6 alleviates bone and muscle loss
Our initial findings revealed that B. animalis significantly decreased following DSS exposure, prompting an investigation into its potential therapeutic relevance in bone and muscle loss. Then, our focus turned to B. lactis A6, a probiotic derived from an elderly individual from Bama, Guangxi, China. This particular strain, as established in our previous research, is renowned for its efficacy in enhancing digestive health, bolstering the immune system, and offering additional benefits.30,31,32 To explore the effects of B. lactis A6 on musculoskeletal health, we orally administered mice with or without either B. lactis A6 during DSS exposure (Fig. S6a). Remarkably, mice treated with B. lactis A6 exhibited increased body weight (Fig. S6b) and diminished serum CK levels, indicating less muscle damage (Fig. 3a). Behavioral analysis demonstrated improvements in limb strength, hanging performance, and exercise capacity (Fig. 3b). Additionally, administration of B. lactis A6 ameliorated muscle mass loss (Fig. 3c) and reduced the expression of muscle atrophy markers Atrogin-1 and Murf-1 (Fig. S6c). Histopathological analysis of via H&E staining showed less sarcolemma disruption and muscle damage with B. lactis A6 treatment, supported by increased CSA and minimal Feret’s diameters of muscle fibers (Fig. 3d and Fig. S6d). Immunofluorescent staining indicated increases in the number of type IIB fibers and decreases in type I fibers after B. lactis A6 treatment, representing a shift in muscle fiber type distribution favoring glycolytic fibers (type IIB) over oxidative fibers (type I) (Figs. 3e and S6e). This trend was notable, given that a shift toward glycolytic fibers has been previously linked with high strength, and powerful contractions.33

Administration of probiotic Bifidobacterium animalis subsp. lactis A6 (B. lactis A6) alleviates gut dysfunction-triggered bone and muscle loss. a Measurement of CK activity of the serum (n = 6). b Assessment of physical performance by handgrip, hanging wire tests, and treadmill, respectively (n = 6). c Muscle mass analysis from each group (n = 6). d Representative images of H&E staining in gastrocnemius cross-sections and quantification of average minimal Feret’s diameter of myofibers (n = 6). Scale bar, 100 μm. e Representative immunofluorescence images to visualize specific types of muscle fibers and fiber type compositions (n = 6). Scale bar, 100 μm. f Representative micro-CT images of distal femoral metaphyseal bone. g Quantitative analysis of bone mass (n = 6). Scale bar, 500 μm. h Representative images of new bone formation assessed by dynamic histomorphometric analyses (n = 6). Scale bar, 25 μm. i Representative images of OSX (green) and OPN (red) immunostainings of OPN+ and OSX+ area on distal femurs (n = 6). Scale bar, 200 and 50 μm, respectively. Quantitative analysis of MAR, BFR/BS (j) and immunofluorescence staining of OPN and OSX (k) in femur tissues. l mRNA expressions of osteogenesis gene (Spp1, Col1a1, Alp, and Bglap) expression in tibia, tested by qPCR (n = 3). m Principal component analysis among the normal, DSS exposure, and B. lactis treatment group. n Correlation analysis of muscle function parameters and bone formation parameters among three groups. o Heatmap of B. lactis A6’s therapeutic efficacies based on indexes of muscle and bone function. Values are presented as the average ± standard deviation. The significance level (P value) was determined through a two-sided Welch’s t-test (a–l) and assessed with one-way ANOVA (m–o)
Regarding bone health, micro-CT analysis revealed that B. lactis A6 administration improved bone density and trabecular structure (Fig. 3f), reflected in higher BMD, BV/TV, Tb. Th and Tb. N values (Fig. 3g). Mechanical stress testing further confirmed the bone-strengthening effects of B. lactis A6, as indicated by increases in Young’s modulus, maximum load, and energy to ultimate load (Fig. S6f). Moreover, dynamic histomorphometric analyses (Fig. 3h) as well as immunofluorescence staining against OSX, OPN, and OCN (Fig. 3i and Fig. S6g) showed significant increases in the MAR, BFR (Fig. 3j), and the numbers of labeled osteoblasts (Fig. 3k and Fig. S6g), while TRAP staining showed a decline in the numbers of labeled osteoclasts (Fig. S6h). Followed the trend, serum bone metabolism marker showed that P1NP level increased and CTX level decreased (Fig. S6i). A qPCR analysis of femurs also showed increased levels of four pro-osteogenic genes (Spp1, Col1a1, Alp, and Bglap) after B. lactis A6 administration (Fig. 3l).
To provide a clearer visualization for evaluating the anti-osteosarcopenia effects of B. lactis A6, we further performed principal component analysis (PCA) of musculoskeletal parameters (Fig. 3m). Remarkably, the B. lactis A6 group exhibited a shift toward the normal group. Pearson correlation analysis revealed strong negative correlations between positive musculoskeletal parameters and the muscle damage parameter CK (Fig. 3n). Overall, the B. lactis A6 group showed enhanced musculoskeletal parameters and decreased muscle damage compared to the DSS group, resembling the normal group patterns (Fig. 3o). Collectively, these findings suggest that probiotic B. lactis A6 administration effectively alleviates bone and muscle loss.
To further investigate the role of B. lactis A6 on bone and muscle health, we conducted an experiment using wide-spectrum antibiotics (ABX)-treated mice with or without B. lactis A6 supplement (Fig. S7a). The result showed that after antibiotics treatment, mice showed decreases in limb strength, hanging performance, and exercise capacity, and B. lactis A6 treatment reversed this process (Fig. S7b). Besides, supplement of B. lactis A6 ameliorated muscle mass loss after antibiotics use (Fig. S7c). Histopathological analysis of H&E staining showed larger muscle fiber with B. lactis A6 treatment, supported by increased minimal Feret’s diameters (Fig. S7d). Also, antibiotics treatment led to increased muscle atrophy and B. lactis A6 reduced the expression of muscle atrophy markers (Fig. S7e). In terms of bone health, mice treated with antibiotics showed decreased trabecular bone in the femur with reduced BMD, BV/TV, Tb. Th, along with increased BS/BV, while B. lactis A6 supplement reversed this trend (Fig. S7f). Additionally, by bone histomorphometric analyses, the MAR and BFR provided further evidence of impaired bone formation after antibiotics use, and a recuperative effect following B. lactis A6 treatment (Fig. S7g). Altogether, these results underscore the potential of B. lactis A6 as a multifaceted agent for combatting bone and muscle loss, offering insights into its mechanisms and therapeutic implications.
B. lactis A6 ameliorates bone and muscle loss by promoting butyrate-producing bacteria and enhancing butyrate production through cross-feeding mechanism
Probiotics are known for favoring beneficial bacteria while suppressing pathogenic strains, thereby fostering a diverse and robust microbial ecosystem.34,35 Based on burgeoning evidence suggesting a gut-musculoskeletal axis,36 we sought to investigate whether the protective effects of B. lactis A6 were attributed to microbiome alterations. Following B. lactis A6 administration, mice exhibited elongated colorectum (Fig. 4a), reduced spleen swelling (Fig. 4b), and lower disease activity index (DAI) score (Fig. 4c). Besides, results demonstrated a significant decrease in FITC-dextran permeability, indicating less intestinal damage and enhanced gut barrier function (Fig. 4d). Pathologically, tissues from the B. lactis A6-treated group showed reduced intestinal wall degradation, lessened crypt injury, and decreased inflammatory cell infiltration (Fig. 4e). The mucin composition and polysaccharides distribution of colon tissues were found increased through Alcian Blue (AB) (Fig. 4f) and periodic acid Schiff (PAS) staining (Fig. 4g). These data suggest that B. lactis A6 strengthens the mucosal layer, improving gut barrier resilience against intestinal damage. To investigate B. lactis A6’s influence on the intestinal barrier, we assessed the gene expression of barrier proteins, including Zonula Occludens-1 (ZO-1), Occludin, and Claudin-1, and observed upregulation, signifying enhanced gut barrier integrity (Fig. 4h, left). Moreover, given the intense inflammatory response characterizing colitis, we examined the gene expressions related to inflammation in colon tissue, including tumor necrosis factor α (TNF-α), interleukin-6 (IL-6), and interleukin-1β (IL-1β). Our results revealed a significant downregulation of these genes following B. lactis A6 supplementation (Fig. 4h, right), suggesting a dampened inflammatory response in the intestinal tissue. Collectively, these findings highlight the role of B. lactis A6 in reducing mucosal barrier damage and subsequent inflammatory responses.

B. lactis A6 alleviates intestinal injury and enhances butyrate-producing bacteria composition. a Images and quantification of colon tissues (n = 6). b Images and quantification of spleen tissues (n = 6). Scale bar, 1 cm. c DAI score evaluation (n = 6). d FITC-dextran concentrations in serum (n = 6). Representative images and quantification analysis of hematoxylin and eosin (H&E) (e), Alcian Blue (AB) (f) and periodic acid Schiff (PAS) staining (g) from each group (n = 6). Scale bar, 50 μm. h mRNA expressions for tight junction proteins (Zonula Occcludens-1 (ZO-1), Occludin, and Claudin-1) (left) and inflammatory indicators (TNF-α, IL-6, and IL-1β) (right) in colon tissues, tested by qPCR (n = 3). i Anosim analysis based on phylum level between the two groups. j Structure plot of the relative fecal bacterial abundances in phylum and genus-level based on Bray–Curtis distance. k, l Analysis of cladogram generated from LEfSe and the heatmap cluster across different taxa levels. m Quantitative analysis of differential taxa in two groups. n Significant differences in metagenomic functions in B. lactis A6 groups compared with DSS controls based on KEGG database. Values are displayed as average ± standard deviation. Significance (P value) is calculated using two-way ANOVA multiple comparisons (c) or two-tailed Welch’s t-test (a, b, d–h)
To decipher the link between B. lactis A6 administration and the alleviation of osteosarcopenia-like phenotypes, we conducted gut microbiota analysis following B. lactis A6 treatment (Fig. S8a, b). Supported by Anosim analysis (Fig. 4i), α-diversity values with Shannon index (Fig. S8c) and β-diversity with PCoA (Fig. S8d), we observed significant differences in species community between the B. lactis A6 and vehicle-gavage DSS-exposed mice. The composition of microbiota was profiled at various taxonomical levels. At the phylum level, B. lactis A6 administration led to notable increases of Firmicutes, Actinobacteria, and Proteobacteria, while decreases in Bacteroidetes (Fig. 4j, left). At the genus level, we observed increases in Bifidobacterium, Faecalibaculum, and Clostridium, while a decrease in Prevotella (Fig. 4j, middle). At species level, B. lactis A6 led to an increase in B. pseudolongum, Firmicutes bacterium M10-2, while a decrease was observed in Prevotella sp. CAG:485 (Fig. 4j, right). A cluster analysis corroborated these alterations in the microbiota composition, further substantiating the role of B. lactis A6 in reshaping gut microbial community (Fig. S8e). Further, LEfSe analysis revealed increased Bifidobacterium, Butyrivibrio, and Eubacterium, alongside decreased Prevotella and Alistipes (Fig. 4k, l and Fig. S8f).
Of note, we noticed a marked rise in the presence of advantageous bacteria that produce butyrate, including Clostridium, Eubacterium, Roseburia, and Butyrivibrio after B. lactis A6 treatment (Fig. 4m). Our examination of metagenomic functions using the KEGG database also showed an increased proportion related to butanoate metabolism (Fig. 4n), indicating enhanced butyrate production. Taken together, our findings propose that B. lactis A6 modulates gut microbiota, promotes butyrate-producing bacteria, and enhances butyrate production. These mechanisms contribute to the beneficial effects of B. lactis A6 in mitigating bone and muscle loss.
The production of butyrate in the gut involves a complex metabolic pathway that requires key substrates, such as acetate and lactate. Additionally, the enzyme butyryl-CoA: acetate CoA-transferase plays a crucial role in converting these substrates into butyrate5 (Fig. S9). Understanding the involvement of these components is essential for elucidating how B. lactis A6 enhances butyrate production. First, we measured the levels of butyrate in cultures of B. lactis A6 and Clostridium butyricum (C. butyricum) (a bacteria responsible for butyrate production, which was increased after B. lactis A6 treatment in our previous data) grown independently and in co-culture. Our results indicated that the butyrate levels were not significantly high when B. lactis A6 or C. butyricum were cultured independently. However, when co-cultured, the butyrate levels increased significantly (Fig. S10a, left). This finding suggests that B. lactis A6 facilitates the production of butyrate by C. butyricum. To delve deeper into the mechanistic aspects, we considered the critical factors and substrates involved in butyrate production, such as acetate and lactate. Then, we measured the levels of acetate and lactate under different conditions. When B. lactis A6 was cultured independently, it produced significant amounts of acetate and lactate. However, when co-cultured with C. butyricum, the levels of these substrates decreased, suggesting their consumption for butyrate production (Fig. S10a, middle and right). This indicates that B. lactis A6 facilitates butyrate production by supplying necessary substrates to C. butyricum. To further confirm the role of these substrates and to eliminate potential confounding factors arising from bacterial interactions, we conducted supplementation experiments. The acids in the supernatant from B. lactis A6 cultures were neutralized and then tested for its effect on butyrate production by C. butyricum (Fig. S10b). Our results showed that the unneutralized supernatant from B. lactis A6 promoted butyrate production by C. butyricum. However, once the supernatant was neutralized, its ability to promote butyrate production was lost. When the neutralized supernatant was supplemented with acetate, lactate, or both, the ability to promote butyrate production was partially restored, with acetate showing a more significant effect than lactate (Fig. S10c). This indicates that acetate and lactate play critical roles in the butyrate production process by C. butyricum, with acetate being more important. Besides, in vivo relevance of these findings was confirmed by administering B. lactis A6 to mice and analyzing the luminal contents of the ileum (Fig. S10d). Measurement of the transcript levels of butyryl-CoA: acetate CoA-transferase revealed significant upregulation in the B. lactis A6-administered group compared to the control group (Fig. S10e). This suggests that B. lactis A6 promotes butyrate production in the gut microbiota through a cross-feeding mechanism with C. butyricum and the modulation of butyrate metabolic pathways.
B. lactis A6 reverses osteosarcopenia-linked butyrate depletion in serum, muscle, and bone tissues
Given increased butyrate-producing bacteria and heightened butanoate metabolism, we hypothesized butyrate’s pivotal function in mediating musculoskeletal development. To investigate this, we focused on gut metabolites, particularly short-chain fatty acids (SCFAs).37,38 We employed GC–MS analysis to assess SCFA levels in serum, muscle (Gast), and bone (femur) samples obtained concurrently from normal, DSS-exposed, and B. lactis A6-treated mice (Fig. 5a). DSS-exposed mice exhibited significant reductions in acetic acid, caproic acid, isovaleric acid, and notably, butyrate levels in serum. Similar trends were observed in muscle, with DSS-exposed mice showing significant decreases in propionic acid, valeric acid, and butyrate. In bone, substantial reductions were noted in butyrate, valeric acid, and caproic acid levels (Fig. 5b, upper and Table S4). Importantly, butyrate levels uniformly decreased across all examined tissues in serum, muscle, and bone. This consistent depletion suggests that changes in gut metabolite profiles resulting from DSS exposure underpin the emergence of bone and muscle loss. Notably, following B. lactis A6 treatment, butyrate levels across serum, muscle, and bone tissues experienced a significant recovery (Fig. 5b, down and Table S5). This observation aligns with our microbiota analysis and supports our hypothesis that alterations in butyrate levels closely correlate with bone and muscle loss, underscoring the therapeutic importance of B. lactis A6 in reversing this change.

B. lactis A6-favored butyrate alleviates bone and muscle and enriches beneficial SCFA-producing bacteria. a Schematic representation illustrating the experimental design. Short-chain fatty acids (SCFAs) were detected in serum, muscle, and bone through GC–MS analysis. b Mean compositions of SCFAs in serum, muscle, and bone from the normal and DSS group (upper), and from the DSS and B. lactis A6 group (down) (n = 6). c Measurement of CK activity of the serum (n = 6). d Assessment of physical performance by handgrip, hanging wire tests, and treadmill, respectively (n = 6). e Muscle mass analysis from each group (n = 6). f H&E staining images in gastrocnemius cross-sections and quantification of average minimal Feret’s diameter of myofibers (n = 6). Scale bar, 100 μm. g Representative immunofluorescence images to visualize specific types of muscle fibers and fiber type compositions (n = 6). Scale bar, 100 μm. h Representative micro-CT images of metaphyseal bone. i Quantitative analysis of bone mass (n = 6). Scale bar, 500 μm. j Representative images and quantification of new bone formation assessed by dynamic histomorphometric analyses (n = 6). Scale bar, 25 μm. k Representative images of OSX (green) and OPN (red) immunostainings of OPN+ and OSX+ area on distal femurs (n = 6). Scale bar, 200 and 50 μm, respectively. l Anosim analysis based on phylum level between the DSS and butyrate group. m, n Analysis of cladogram generated from LEfSe and the heatmap cluster across different taxa levels. Values are represented as the average ± standard deviation. The significance level (P value) was determined through a two-sided Welch’s t-test
Butyrate supplementation alleviates bone and muscle loss and protects intestinal barrier function
With a consistent butyrate decrease in serum, muscle, and bone after DSS exposure, and considering the critical role of butyrate in diseases including rheumatoid arthritis,39 acute myeloid leukemia,40 etc., we further explored its therapeutic potential for bone and muscle loss. After administrating butyrate to mice (Fig. S11a), we observed notable gains in body weight (Fig. S11b) and reductions in serum CK levels (Fig. 5c). Behavioral analyses revealed improvements in muscle functions (Fig. 5d), and increases in Gast mass (Fig. 5e). qPCR analysis also showed reduced expression of atrophy markers (Fig. S11c). Besides, H&E staining confirmed improved muscle integrity and increased muscle fiber size after butyrate supplementation (Fig. 5f and Fig. S11d). Immunofluorescence staining outcomes further underscored a significant rise in type IIB fibers and a reciprocal decrease in type I/type IIA fibers (Fig. 5g and Fig. S11e). For bone, micro-CT data showed enhanced skeletal density and structure in butyrate-treated mice, with higher BMD, BV/TV, Tb. Th, and Tb. N measurements (Fig. 5h, i). Mechanical stress testing indicated enhanced bone strength (Fig. S11f). Dynamic histomorphometric analyses (Fig. 5j) and immunofluorescence staining (Fig. 5k) showed significant increases in the MAR, BFR (Fig. S11g), and the numbers of OSX-, OCN- and OPN-positive osteoblasts (Fig. S11h, j) in the butyrate-gavaged mice, while the numbers of TRAP-positive osteoclasts decreased (Fig. S11k). Serum bone metabolism analysis revealed elevated serum levels of PINP, signifying heightened bone formation, whereas diminished levels of CTX indicate decreased bone resorption (Fig. S11l). qPCR analysis also demonstrated upregulated pro-osteogenic genes (Fig. S11i). These findings support the beneficial role of B. lactis A6-favored butyrate in mitigating gut dysfunction-induced bone and muscle loss.
The intestinal tract is the main location for butyrate synthesis, where it chiefly serves as fuel for epithelial cells, enhancing intestinal barrier function.41 To investigate whether butyrate could preserve gut barrier function, we administered butyrate to DSS-exposed mice. Results showed that butyrate administration led to elongated colorectum (Fig. S12a), diminished spleen swelling (Fig. S12b), and decreased DAI score (Fig. S12c). We also found that these mice exhibited improved gut barrier integrity, as indicated by reduced FITC-dextran permeability (Fig. S12d). Further, colon pathological evaluation presented lesser crypt damage (Fig. S12e), more expansive mucin (Fig. S12f), and wider distribution of polysaccharides in the intestinal mucosa (Fig. S12g). Aligned with these findings, tight junction molecules were observed upregulated (Fig. S12h), and inflammatory indicators downregulated (Fig. S12i). In summary, these results indicated that butyrate protects gut barrier function, reduces endothelial damage, and consequently mitigates bone and muscle loss.
Studies have revealed microbiome alterations in volunteers consuming butyrylated high amylose maize starch, implying that butyrate selectively modulates gut bacteria.42,43 Through metagenomics sequencing (Fig. S13a, b), we observed noteworthy differences in species abundance, validated by Anosim analysis (Fig. 5l), α– and β-diversity values (Shannon and Simpson index) (Fig. S13c, d) between butyrate and vehicle-gavage group. Following butyrate treatment, the LEfSe analysis indicated augmented levels in genera including Clostridium, Faecalibaculum, Eubacterium, Roseburia, and Butyrivibrio, while noting diminished levels in Lactobacillus, Prevotella, and Bacteroides (Fig. 5m, n and Fig. S13e). Microbiome alterations were further profiled at multiple taxonomic levels through cluster analysis (Fig. S13f, g). Many of the genera that increased, such as Clostridium, Eubacterium, Roseburia, Butyrivibrio, and Faecalibaculum, contain species known to produce butyrate or other SCFAs that are beneficial to gut health (Fig. 5n). These alterations may enhance SCFA concentrations, potentially benefiting gut barrier function and reducing inflammation. Overall, they support the protective effects of B. lactis A6-favored butyrate supplementation against intestinal injury and dysfunction, suggesting synergy between butyrate, gut microbes, and digestive health.
Butyrate reduces inflammation in T cells and inhibits NF-κB pathway activation
In our previous investigation,44 we observed a common transition toward pro-inflammatory phenotypes in CD4+ T cells across tissues during the process of inflammaging. These cell populations were characterized by an enrichment of genes associated with pro-inflammatory IL-17 and TNF signaling pathways, along with evident pro-inflammatory traits and heightened cytotoxicity. Notably, the nuclear factor kappa B subunit (NF-κB), a core component of the NF-κB signaling pathway, emerged as a direct downstream target in both Th1-like and Th17 cells, implicating its pivotal role in orchestrating the pro-inflammatory transition in T cells. In this study, we observed a synergistic recovery effect of butyrate intervention on muscles and bones, leading us to hypothesize the presence of an upstream common regulatory mechanism. Specifically, we sought to elucidate whether butyrate influences the shared pro-inflammatory state in T cells and whether this modulation is mediated by NF-κB activation. In our previous study,44 CD4+ T cells in aged muscle experience Th1-like differentiation, and, in bone, a skewing toward Th17 cells was observed. Then, to determine whether Th1 and Th17 cells also exhibit a change after butyrate treatment, we isolated T cells from bone marrow and detected them through flow cytometry. In our study, we found that the proportion of Th 1 and Th17 cells, which are responsible for pro-inflammatory features, were higher in the DSS-exposed group than the normal group and this trend was reversed with the butyrate supplementation (Fig. 6a, b). This indicates that DSS-exposure turn T cells into pro-inflammatory phenotype in the bone marrow, which may play a potential role in the change of bone and muscle, validating the role of T cells in mediating inflammaging, as elucidated in our previous study.44 Furthermore, butyrate administration attenuated inflammation-induced bone and muscle loss by regulating the activity of Th1 and Th17 cells. Of note, various factors including reactive oxygen species and cytokines such as TNF-α, IL-6, and IL-1β can activate the inflammatory response. Consistent with our hypothesis, we observed a decline in the serum concentration of inflammatory cytokines, including TNF-α, IL-6, IL-1β, and IL-17, following butyrate treatment (Fig. 6c). This alteration revealed a shift in bone marrow T cells toward a pro-inflammatory phenotype in the context of DSS-induced gut dysfunction. This shift was significantly mitigated by butyrate supplementation, indicating a direct influence of butyrate on modulating immune cell behavior, thereby potentially contributing to the observed synergistic effect on muscle and bone health.

Butyrate reduces inflammation in T cells and inhibits NF-κB pathway activation. a, b Percentages of Th1 and Th17 cells detected by flow cytometry (n = 5). c Concentration of TNF-a, IL-6, IL-1β, and IL-17 in serum analyzed by ELISA (n = 5). d Immunofluorescence with NF-κB antibody in T cells from normal, DSS-exposed, and butyrate-treated mice. Immunopositive cells for nuclear NF-κB were quantified as percent of total cells (n = 3). Scale bar, 5 μm. e Representative WB images and quantitative analyses of p-P65, P65, p-IκB, and IκB (n = 3). Micro-CT images (f) and quantification of BMD, Tb. N (g) in DSS group, butyrate-treated group, NF-κB inhibitor group, butyrate + NF-κB inhibitor group and butyrate + NF-κB inhibitor group. Scale bar, 500 μm. Quantification of serum CK (h), grip strength, wire-hanging time, and distance to exhaustion (i) in different groups. Values are represented as the average ± standard deviation. The significance level (P value) was assessed with one-way ANOVA
The NF-κB is a pleiotropic transcription factor that has been reported to be closely associated with inflammation-related dysfunction in various contexts.45 In our previous investigation,44 the NF-κB signaling pathway was found as a direct downstream target in both Th1-like and Th17 cells and orchestrated the pro-inflammatory transition in T cells. Since NF-κB is pivotal in regulating T cell phenotype, particularly through phosphorylation of p65, a critical step in the NF-κB signaling cascade leading to nuclear translocation and subsequent transcriptional activation, we isolated T cells from bone marrow to assess the inflammatory NF-κB levels. Although the relationship between gut microbiota-derived butyrate and NF-κB is complex, it is generally accepted that butyrate suppressed NF-κB activation and reduce NF-κB-mediated inflammatory signaling. In contrast, multiple investigations have demonstrated that gut dysfunction can support NF-κB activation. The possible reason for this is that gut dysfunction increased the phosphorylation of IκB, triggering its degradation and allowing NF-κB to enter the nucleus. According to our research, DSS-exposed T cells exhibited an increased proportion of p65 protein entry into the nucleus (Fig. 6d), as well as increased protein expression of p-IκB and p-P65 compared to the control group (Fig. 6e). This indicates that NF-κB pathway was turned on by DSS exposure. The addition of butyrate, however, resulted in decrease in the proportion of NF-κB entering the nucleus, as well as p-IκB and p-P65 protein expression (Fig. 6d, e). The data above indicated that butyrate can counteract the activation of NF-κB in T cells caused by DSS-induced gut dysfunction. This finding supports the notion that butyrate alleviated inflammation-induced bone and muscle loss through reducing T cell pro-inflammatory activity and inhibiting NF-κB signaling activation.
To further figure out whether these changes in the NF-κB pathway mediated the butyrate-induced improvements in bone and muscle phenotypes, we also established five experimental groups: DSS control, butyrate-treated, NF-κB inhibitor, butyrate combined with NF-κB inhibitor, and butyrate combined with NF-κB activator group. After treatment, micro-CT analysis of trabecular bone showed a marked improvement in bone density and trabecular structure in the butyrate-treated group compared to the DSS control (Fig. 6f). The NF-κB inhibitor group and the group treated with butyrate and the NF-κB inhibitor also displayed significant bone loss alleviation. Quantification of BMD and Tb. N further supported these findings (Fig. 6g). Serum CK levels and behavioral analyses in limb strength, hanging performance, and exercise capacity were measured to assess muscle health. The butyrate-treated group showed lower serum CK levels and improved muscle functions compared to the DSS group. The NF-κB inhibitor group and the group treated with butyrate and the NF-κB inhibitor showed great muscle health indicators. (Fig. 6h, i). Interestingly, while both butyrate and the NF-κB inhibitor alleviated bone and muscle loss individually, their combination did not produce a synergistic effect, suggesting that NF-κB is a critical target in the butyrate pathway. This was further confirmed by the observation that co-treatment with butyrate and the NF-κB activator negated the protective effects of butyrate, reinforcing the conclusion that butyrate’s therapeutic effects are mediated through NF-κB pathway modulation (Fig. 6f–i). These results indicate that butyrate effectively reduces bone and muscle loss through modulation of the NF-κB pathway. Targeting the NF-κB pathway could be a crucial strategy in enhancing butyrate’s therapeutic efficacy in musculoskeletal health.
link